
Fool in the Shower
The headlines paint a picture of inflation trending lower, though still well above the Fed’s required range, and an economy that is resilient to interest rate increases. Steady hiring (3.1 million added jobs over the past 12 months) and robust consumer spending have shifted consensus towards accepting a soft landing as its base case scenario. In the past month, Bank of America scrapped its forecast of a US recession, Goldman cut its recession probability for the third consecutive month to just 15%, and the WSJ published a front-page article titled “Resilient US Economy Defies Expectations”. Consensus is not always the best predictor of the future. To better understand what lies headed, it is useful to analyze both the economic resilience and inflationary trends in more detail. The economy’s resilience can be explained by several factors, some structural and some temporary or coincidental. The most important structural factor is the health of the private sector, which contrasts with vulnerabilities normally evident as expansion matures. Households and businesses received trillions of dollars in financial assistance in 2020/21 and, unlike the typical peak of an economic cycle where we see rising leverage and an overextension in durable spending, the starting position today is one of strength. Many other factors come down to timing issues. One example can be seen in the expansionary fiscal spending. The effect of government spending on aggregate demand can be measured by the change in the deficit as a % of GDP, a rise in the deficit is stimulative and vice versa. The 2023 fiscal deficit is tracking around $1.8tn (excluding the effect of the reversal of the student debt cancellation plan that has no effect on net federal outflows). It equates to 7% of GDP, up from 3.8% in 2022, the third largest increase since 1950, after only FY08 and FY20!! The reasons are largely transitory (e.g., social security payments rose due to a Cost-Of-Living-Adjustment provision that tracks last year’s CPI at +8.7%) but there’s still almost $1 trillion more spending not matched by taxes. The effect will reverse next year with the deficit expected to narrow by over 2 pct points (Figure 1).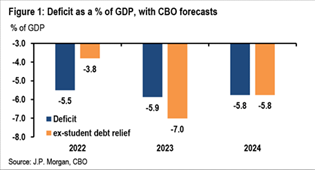 Another factor has been the pent-up demand in sectors where supply was previously constrained. For example, automotive production, which is typically sensitive to higher rates, has been less affected this time as it’s still catching up with orders from prior years, while hotel occupancy has been running almost at par with 2019 levels despite room rates being 40% higher or more. It is difficult to see how some of those patterns don’t change as we move into next year. Broad inflation readings point towards a declining trend, but it is important to look at the underlying components. Core inflation, which excludes volatile food and energy prices, has three parts: goods, housing, and non-housing services. Goods inflation skyrocketed in 2021 when excess demand, supported by fiscal transfers and low interest rates, coincided with severe supply disruptions caused by the pandemic. The motor vehicle sector is a perfect example of prices spiking due to this demand/supply imbalance. As supply issues got resolved and higher rates began to stifle demand for high-priced items, inflation for goods retraced to more normal levels (Figure 2, LHS). The housing sector, which is highly interest-sensitive, is also on track to see inflation moderate, but this will take time to work its way into the official data because leases turn over slowly. The last category, non-housing services, which accounts for over half of the inflation index, is where the data is less encouraging (Figure 2, RHS). This part of the economy was less affected by global supply bottlenecks, has lower sensitivity to interest rates, and is relatively labor intensive, at a time when supply of labor is tight.
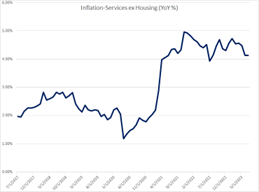
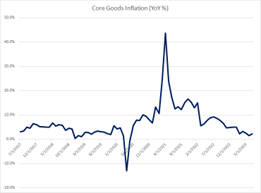
 The soft-landing paradox is that the more resilient the economy, the more improbable it is for non-housing services inflation to revert to 2%, which would in turn allow the Fed to reverse course on interest rates. That will likely require consumer demand for services to weaken materially and labor market conditions to ease, economic trends that often coincide, at least in their initial stages, with declining asset prices. Equity markets have moved higher this calendar year and are well off the 2022 lows. Over a longer timeframe, the trend is more one of a rangebound market, with all major indices still negative over two years. In fact, the rangebound market trend is now more than five years old if we exclude the effect of six US TMT Mega Caps: Amazon, Microsoft, Apple, Google, Meta, and Nvidia. Since 2017, the market capitalization of these six firms has grown by a combined $8 trillion, while that of the entire Russell 2000 has grown by less than $500B, despite starting from a similar level. Many investment funds have been wrong footed this year by bearish market bets, but it is still unclear whether they were wrong on the thesis or just the timing. There is a great metaphor by Nobel laureate Milton Friedman about the “fool in the shower”. When the fool realizes the water in the shower is too cold, he turns on the hot water but there is often a time lag before the temperature adjusts. If he does not account for the lag but keeps adding hot water, he soon finds himself in a situation where the temperature is boiling hot and requires him to start adding cold water again! Friedman coined the term to describe central banks acting too forcefully to either stimulate or slow down an economy, which then swings the pendulum too far to the other side, causing a whole new set of problems. A stimulus response that was both too rapid and disproportionate to the economic damage caused by the pandemic, has led to inflation and an overheated economy. Now, interest rates are much higher and lending conditions tighter, but the effects are not yet widely felt in either the economy or financial markets. Even before accounting for the economy’s healthy starting position, there is typically a 5-6 quarter lag for the monetary policy impact to work its way through the system. The next 2-3 quarters should provide more information on where we’re headed and whether the small, local “recessions” we’re already seeing in areas such as US commercial real estate, advertising, or German exports, can become widespread.
Figure 1. Fiscal spending provided a major stimulus in 2023 but will reverse in 2024.
Another factor has been the pent-up demand in sectors where supply was previously constrained. For example, automotive production, which is typically sensitive to higher rates, has been less affected this time as it’s still catching up with orders from prior years, while hotel occupancy has been running almost at par with 2019 levels despite room rates being 40% higher or more. It is difficult to see how some of those patterns don’t change as we move into next year. Broad inflation readings point towards a declining trend, but it is important to look at the underlying components. Core inflation, which excludes volatile food and energy prices, has three parts: goods, housing, and non-housing services. Goods inflation skyrocketed in 2021 when excess demand, supported by fiscal transfers and low interest rates, coincided with severe supply disruptions caused by the pandemic. The motor vehicle sector is a perfect example of prices spiking due to this demand/supply imbalance. As supply issues got resolved and higher rates began to stifle demand for high-priced items, inflation for goods retraced to more normal levels (Figure 2, LHS). The housing sector, which is highly interest-sensitive, is also on track to see inflation moderate, but this will take time to work its way into the official data because leases turn over slowly. The last category, non-housing services, which accounts for over half of the inflation index, is where the data is less encouraging (Figure 2, RHS). This part of the economy was less affected by global supply bottlenecks, has lower sensitivity to interest rates, and is relatively labor intensive, at a time when supply of labor is tight. Figure 2. Goods Inflation has normalized but non-housing services inflation remains elevated.
The soft-landing paradox is that the more resilient the economy, the more improbable it is for non-housing services inflation to revert to 2%, which would in turn allow the Fed to reverse course on interest rates. That will likely require consumer demand for services to weaken materially and labor market conditions to ease, economic trends that often coincide, at least in their initial stages, with declining asset prices. Equity markets have moved higher this calendar year and are well off the 2022 lows. Over a longer timeframe, the trend is more one of a rangebound market, with all major indices still negative over two years. In fact, the rangebound market trend is now more than five years old if we exclude the effect of six US TMT Mega Caps: Amazon, Microsoft, Apple, Google, Meta, and Nvidia. Since 2017, the market capitalization of these six firms has grown by a combined $8 trillion, while that of the entire Russell 2000 has grown by less than $500B, despite starting from a similar level. Many investment funds have been wrong footed this year by bearish market bets, but it is still unclear whether they were wrong on the thesis or just the timing. There is a great metaphor by Nobel laureate Milton Friedman about the “fool in the shower”. When the fool realizes the water in the shower is too cold, he turns on the hot water but there is often a time lag before the temperature adjusts. If he does not account for the lag but keeps adding hot water, he soon finds himself in a situation where the temperature is boiling hot and requires him to start adding cold water again! Friedman coined the term to describe central banks acting too forcefully to either stimulate or slow down an economy, which then swings the pendulum too far to the other side, causing a whole new set of problems. A stimulus response that was both too rapid and disproportionate to the economic damage caused by the pandemic, has led to inflation and an overheated economy. Now, interest rates are much higher and lending conditions tighter, but the effects are not yet widely felt in either the economy or financial markets. Even before accounting for the economy’s healthy starting position, there is typically a 5-6 quarter lag for the monetary policy impact to work its way through the system. The next 2-3 quarters should provide more information on where we’re headed and whether the small, local “recessions” we’re already seeing in areas such as US commercial real estate, advertising, or German exports, can become widespread.